Last Update: July 8, 2021.
Description
This web application is aimed to enable non-specialists of AI to use AI technology easily.
Bayesian Optimization (BO) would be benefical for the researchers in material or chemical sciense. However, these method seems to be difficult to apply/use for the researchers.
We would be happy if this web application helps your research. And your feedback is welcome (The contact information is available at the bottom of this page).
Note
Because of resource limitation of the server, execution with much data is not allowed.
The data you inputed or uploaded is not keeped on the server.
The connection while you use this application is encrypted (https connection).
We shall assume no responsibility for any losses or damages incurred by the User or third parties related to the User using the service on this site (including damage to software, data, and hardware, etc. other than this software).
Bibliography
Please cite the following article if you use this application for your work.
Daisuke TANAKA and Susumu NAKAYAMA:
Elementary approach on the prediction of next material composition using AI technology: Improvement of characteristic by changing two components
Studies in Science and Technology, 2021, Volume 10, Issue 1, Pages 79-84, (2021)
How to Use
Our application is available at the following URL (No installation required, but the newest version of Firefox, Chrome, Safari, or Microsoft Edge is recommended):
1. Launching Application
On the website, click application you would like to use.
Then, the application will appear at the new tab.
2. Edit Data
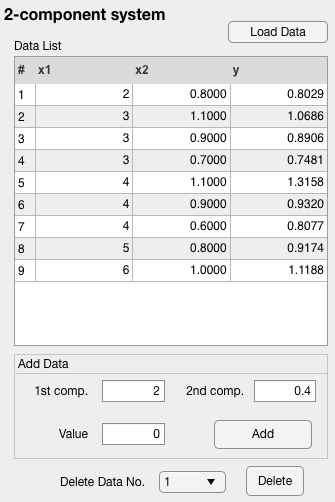
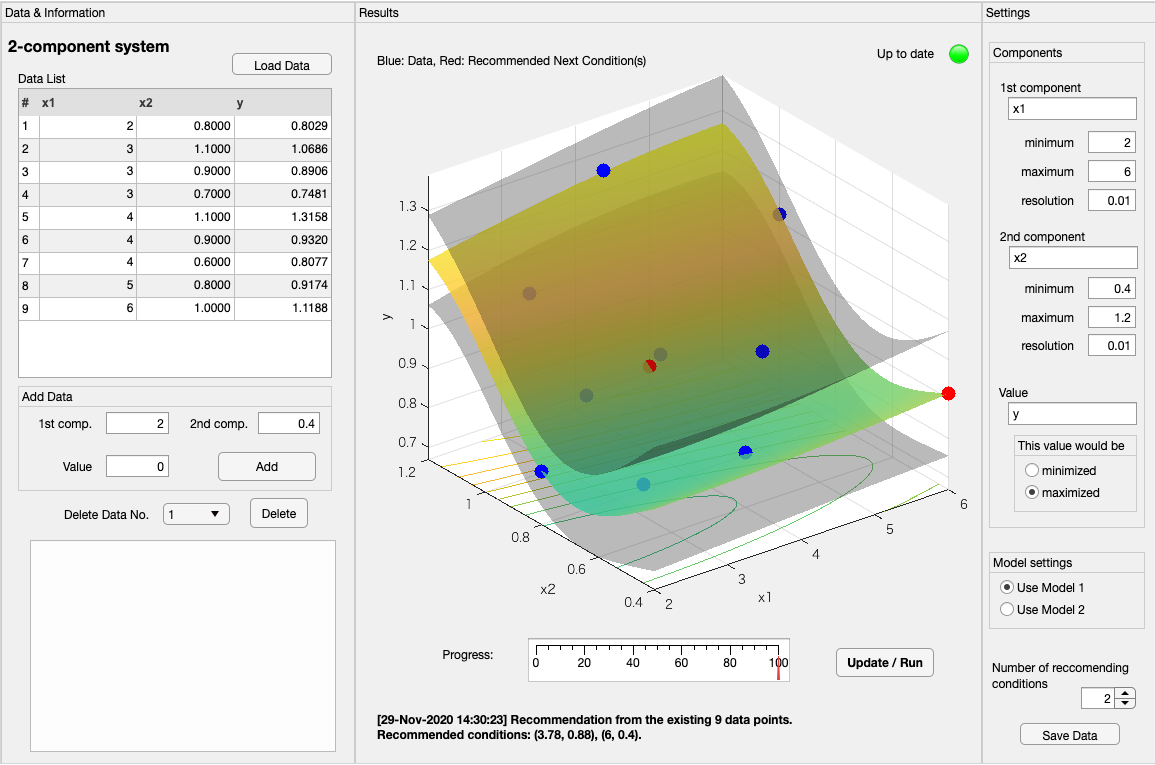
As you can see at the left column, 9 data are already inputed. You can add your data or delete the existing data at the UI.
3. Settings
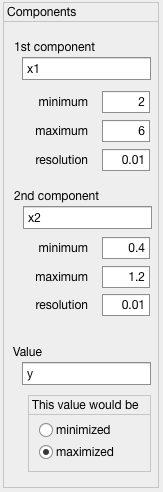
See the right column. You can set the properties for the recommendation.
For each component, name (it doesn't effect to the recommendation), the minimum value, the maximum value, and the resolution should be inputed. In this case, the 1st component x1 will be optimized (recommended) for x1 = 2, 2.01, 2.02, ..., 5.99, 6.
For the value (to be minimized/maximized), you can input its name, and select your desire.
The model used for finding the relationship between the component and value can be changed at the model settings. DO NOT CHANGE THIS OPTION WHILE YOUR EXPERIMENTATION.
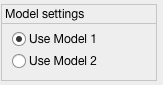
Model 1
Default selection. If the scale of 1st and 2nd components differs (e.g. 0.1 < x1 < 0.8 and 100 < x2 < 200), this option will be suitable.
Model 2
If Model 1 fails to model the relationship, use this option (see Section 6).
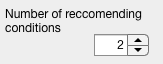
The number of recommending conditions can be changed from 1, 2, ..., 5.
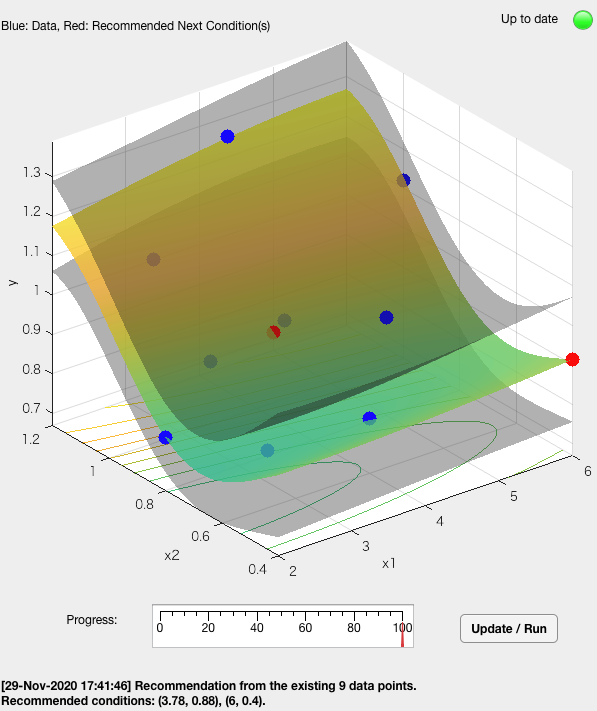
4. Recommendation
Push the Update/Run button. After a few seconds (depends on the number of data), you can see the graph and the recommended conditions at the middle column.
5. Save the current settings and data
Push [Save Data] button at the right column, then a pop-up window to select the directory to be saved appears. The saved file would be loaded using the button [Load Data] at the left column.
Note that the file can be edited using Excel or other applications. However, keep the layout of the file. You can use the following template file (Excel file) instead of inputing or setting using this UI.
6. Choosing the model / number of data
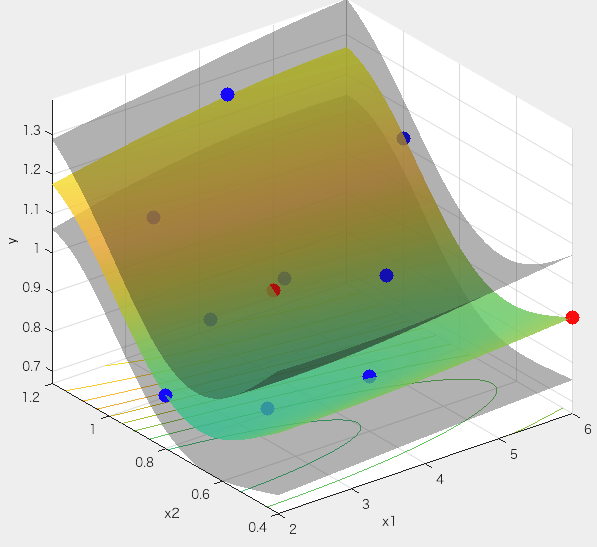
If the smooth curve is obtained, the model is suitable, and it seems the number of data is enough.
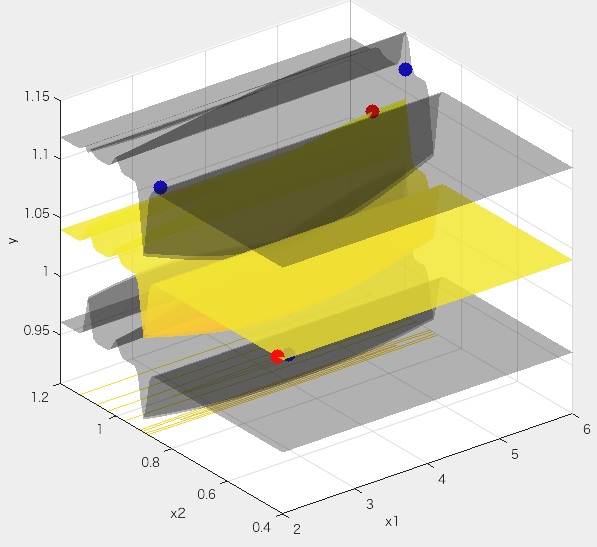
If the jagged curve is obtained, it seems the model is NOT suitable or the number of data is lacked. Changing the model or adding new data is recommended.